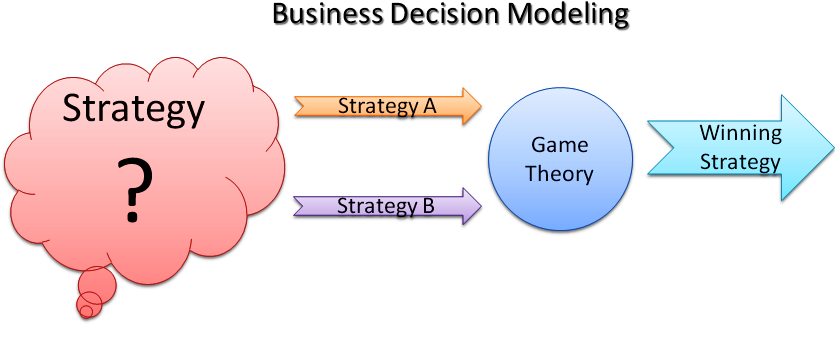
What do you do when you can’t quite figure out which
of two strategies is best for your new business idea?
You simulate. Experts in
economic modeling and business decision modeling recommend that you simulate your strategies before actually
adopting them through game theory.
What is Game
Theory?
No, game theory has
nothing to do with video games or games you play with friends at the club house!

With game theory,
businesses have a tool for making optimized guesses with respect to winning
strategies for their products, services, or processes.
[Related Article: Understanding Market Saturation - Why You Should Never Hesitate]
[Related Article: Understanding Market Saturation - Why You Should Never Hesitate]
How Do Business
Games Work?
In a simple business
game, you have two prospects, A and B. Consider the example below:

In this example, a
business owner wants to decide between two prospects; either opening a new
office (A) or expanding the current office (B) with the goal of generating the
highest sales by the end of the year.
Case
Study: Figuring Out Sales
To demonstrate game
theory, we’re going to use the scenario described above as a case study. To move
forward, we have to figure out how to arrive at a simple equation for sales. Don’t
panic – it’s elementary:

Visibility
As shown above, we first
describe your business’ visibility as the portion of the
local population that is within your catchment factor. Catchment factor
figures tend to be higher for products and services that are required daily or
very frequently, as opposed to luxury or specialty products.
A reasonable catchment
factor for a produce store can be 20% (adjusting for competition) while that
for a luxury makeup store can be something like 3%.
So let’s say you run a
produce store with a catchment factor of 20% in an area with a population of
10,000 people. Your visibility is 10000 x 20% = 2000 people. This means the
maximum exposure for your business in that area is around 2,000 people.
Demand
Once you know your
visibility, the next step is to figure out demand. What portion of your visible
population is confident enough to buy your products or use your services?
For the purpose of this
case study, let’s keep the confidence factor at 20% (for a very credible and well-advertised
business). This gives us a demand of 2000 x 20% = 400 people. This means you
can expect to have about 400 regular customers year-in, year-out. This is your estimated fixed demand.
Daily Demand
Now you know your
estimated fixed demand, the next question is: what portion of your fixed demand
comes to your store daily? This is useful for simulation purposes.
For this case study,
which involves a produce company, it is reasonable that up to a quarter (25%)
of the fixed demand will come to the store each day due to highly perishable
goods. This is the daily factor. Daily demand in this case is therefore 400 x 25%
= 100 people. This means 100 people visit the produce store each day.
Daily Sales
Figuring out the daily
sales is easy at this point because every store owner knows the average
quantity of items bought (per customer) per day and the average cost of items
in the store. Your POS application and automated sales reports can probably
tell you that.
Let’s say for this case
study, the produce store sells an average of 5 items per customer per day, with
an average cost of $10 for items in the store. Daily sales is simply 100 x 5 x
10 = $5,000 (per day).
Total Sales
This is simply the
product of daily sales and the number of days we are considering. For a 30-day
period, total sales in this case can be projected at 5000 x 30 = $150,000.
Simulation:
Building Variables and Weighing the Prospects
Now that we have arrived
at a convenient way of calculating sales, we then move on to the important task
of evaluating two prospects (A and B) to see which generates higher sales over
time.
To do this, we need to
build models for each of the prospects.
Modeling Prospect A: Opening a New Office

As shown above, we
select the daily sales for the new office to vary between 20% and 80% of the
current office sales because the current office is more established, and it has
more dedicated customers.
Modeling Prospect B: Expanding the Current Office +
Advertising

For
the second strategy (a mix of office expansion and advertising), we reasonably fix
the expanded office sales at between 10% and 20% more sales daily compared to
the current office. Additionally, we estimate that advertising will pull in an
extra 2% to 10% more sales daily (for the expanded office).
It’s
now time to simulate these two prospects over a large number of cycles or ‘games’
to determine which one pulls in the highest sales in the period under
consideration. Let’s assume that the period of simulation is 6 months and the
current daily sales is $5,000 as previously calculated.
Simulation Results: Produce Store Sales Strategy
A simple computer program
was required to simulate the total period sales for prospects A and B. I created
the program and ran this simulation for 10,000 cycles. Results are shown below:
Prospect A Sales ($, after 6 months)
|
Prospect B Sales ($, after 6 months)
|
1,349,586.82
|
1,096,734.11
|
1,348,620.29
|
1,096,658.02
|
1,348,884.86
|
1,096,665.31
|
1,347,971.19
|
1,096,760.43
|
1,349,250.91
|
1,096,743.23
|
1,348,760.7
|
1,096,785.42
|
1,348,480.92
|
1,096,705.68
|
1,349,177.55
|
1,096,750.2
|
1,348,943.75
|
1,096,730.62
|
1,348,972.28
|
1,096,784.42
|

Prospect
A (opening up a new
office) showed higher sales figures (approx. $1.348 million at the end of the period) than
the option (prospect B) but lower long-term
growth stability. This may mean that even though sales will be much higher
in the short term, they will tend to stabilize or flatten at some point.

Prospect
B (expanding current
office and setting up advertising) showed lower
sales figures (approx. $1.096 million at the end of the period) but higher long-term growth
stability. Observe how the general trend of the sales figures is upwards as
opposed to prospect A with a relatively stable-to-downward sales figure trend.
If the business owner uses prospect B as a strategy,
s/he will experience higher long-term growth amidst lower short-run sales compared
to prospect A.
This is the type of analysis and insight you get by
using game theory to model your business decisions before making them.
I
hope you enjoyed reading this article! If you have a question about simulation
and game theory email me at montyblogger2014@gmail.com
or just reply below with your comments!
No comments:
Post a Comment